1 2 3 4 5 6 7 8 9 10 11 12 13 14 15 16 17 18 19 20 21 22 23 24 25 26 27 28 29 30 31 32 33 34 35 36 37 38 | """
Simple contact map Chord plotting
=================================
This script contains a simple example of how you can plot
contact maps in Chord Diagram style using ConKit
"""
import conkit
# Define the input variables
sequence_file = "toxd/toxd.fasta"
sequence_format = "fasta"
contact_file = "toxd/toxd.mat"
contact_format = "ccmpred"
# Create ConKit hierarchies
# Note, we only need the first Sequence/ContactMap
# from each file
seq = conkit.io.read(sequence_file, sequence_format).top_sequence
conpred = conkit.io.read(contact_file, contact_format).top_map
# Assign the sequence register to your contact prediction
conpred.sequence = seq
conpred.assign_sequence_register()
# We need to tidy our contact prediction before plotting
conpred.remove_neighbors(inplace=True)
conpred.sort('raw_score', reverse=True, inplace=True)
# Finally, we don't want to plot all contacts but only the top-L,
# so we need to slice the contact map
map = conpred[:conpred.sequence.seq_len]
# Then we can plot the map
contact_plot = "toxd/toxd.png"
conkit.plot.ContactMapChordFigure(map, file_name=contact_plot)
|
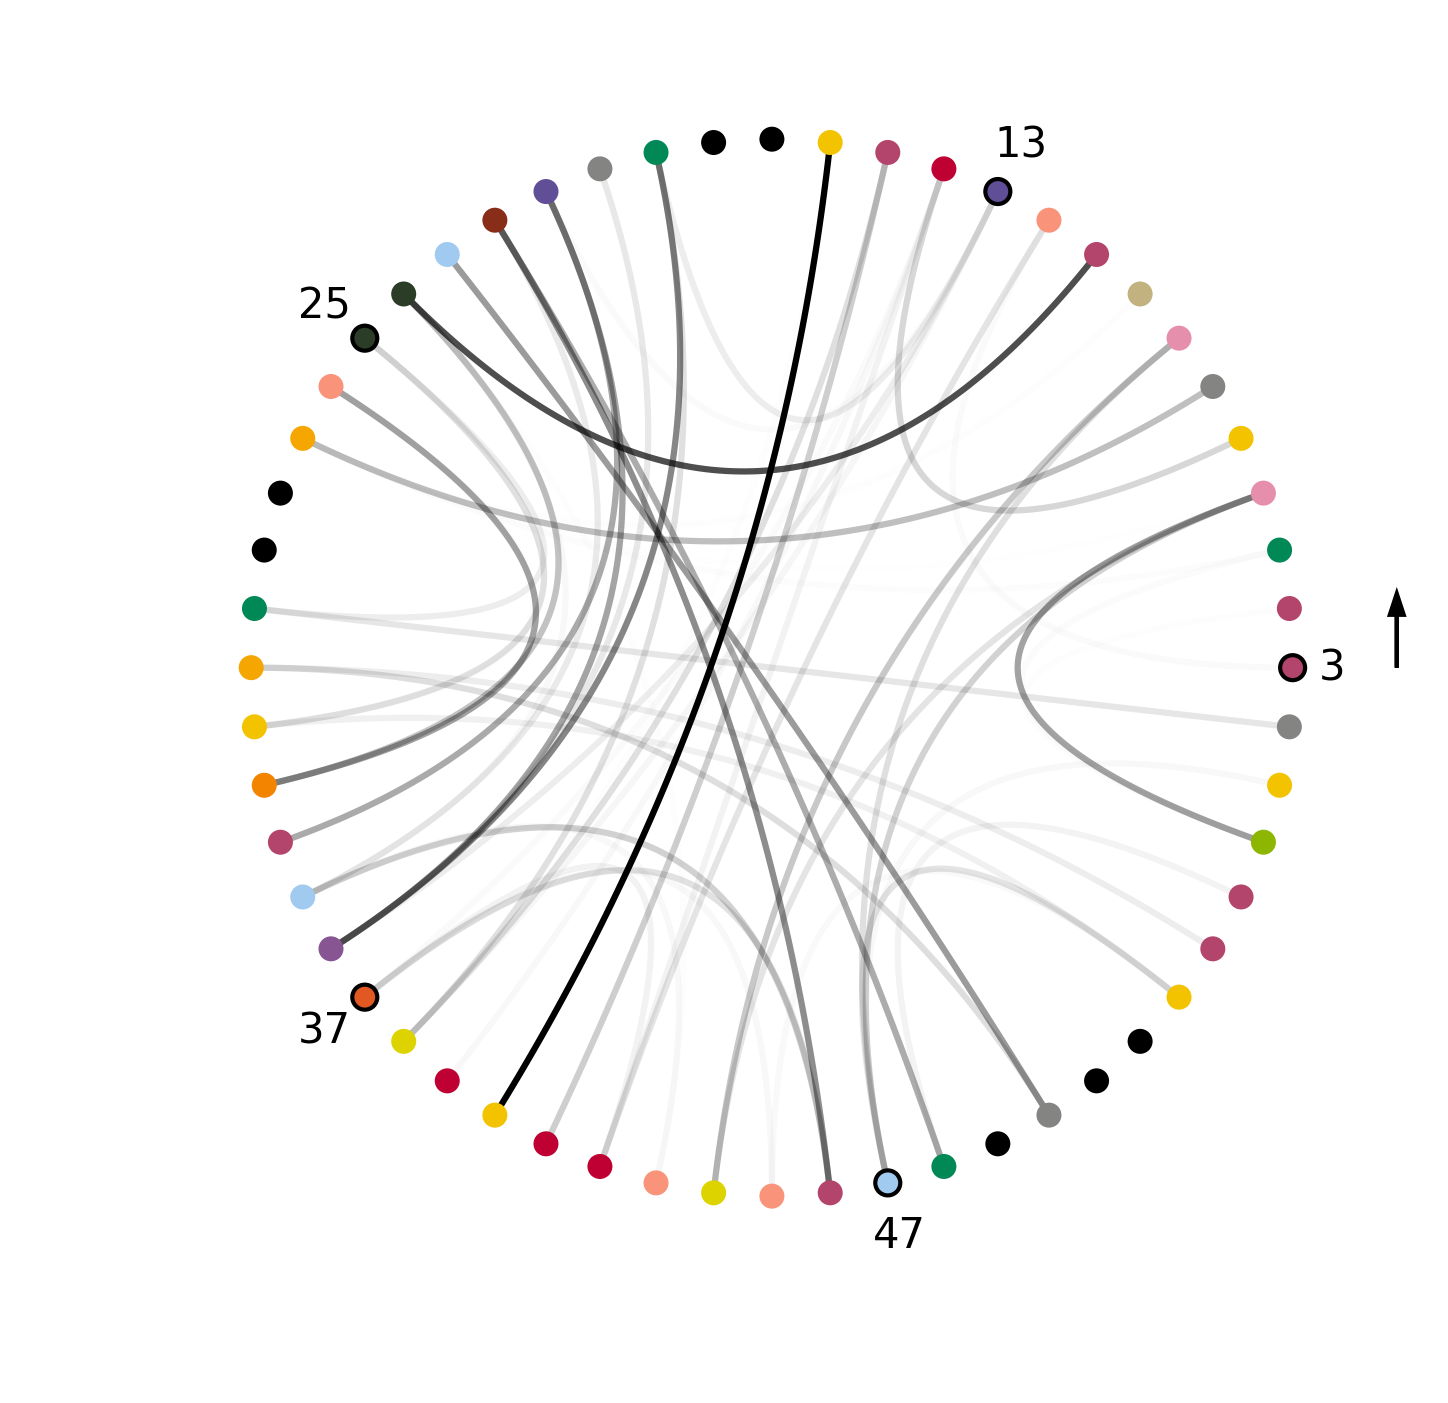
Each residue in the Chord plot corresponds to an amino acid in your sequence. For a full list of the encoding used, check the ContactMapChordFigure.
The color coding of the full sequence used is the following:
Q P R R K L C I L H R N P G R C T Y D K I P A F Y Y N Q K K K Q C E R F D W S G C G G N S N R F K T I E E C R R T C I G