Contact Map Matrix Plotting
If you would like to plot a contact map using ConKit without the overhead of using Python, you can simply use the conkit-plot script.
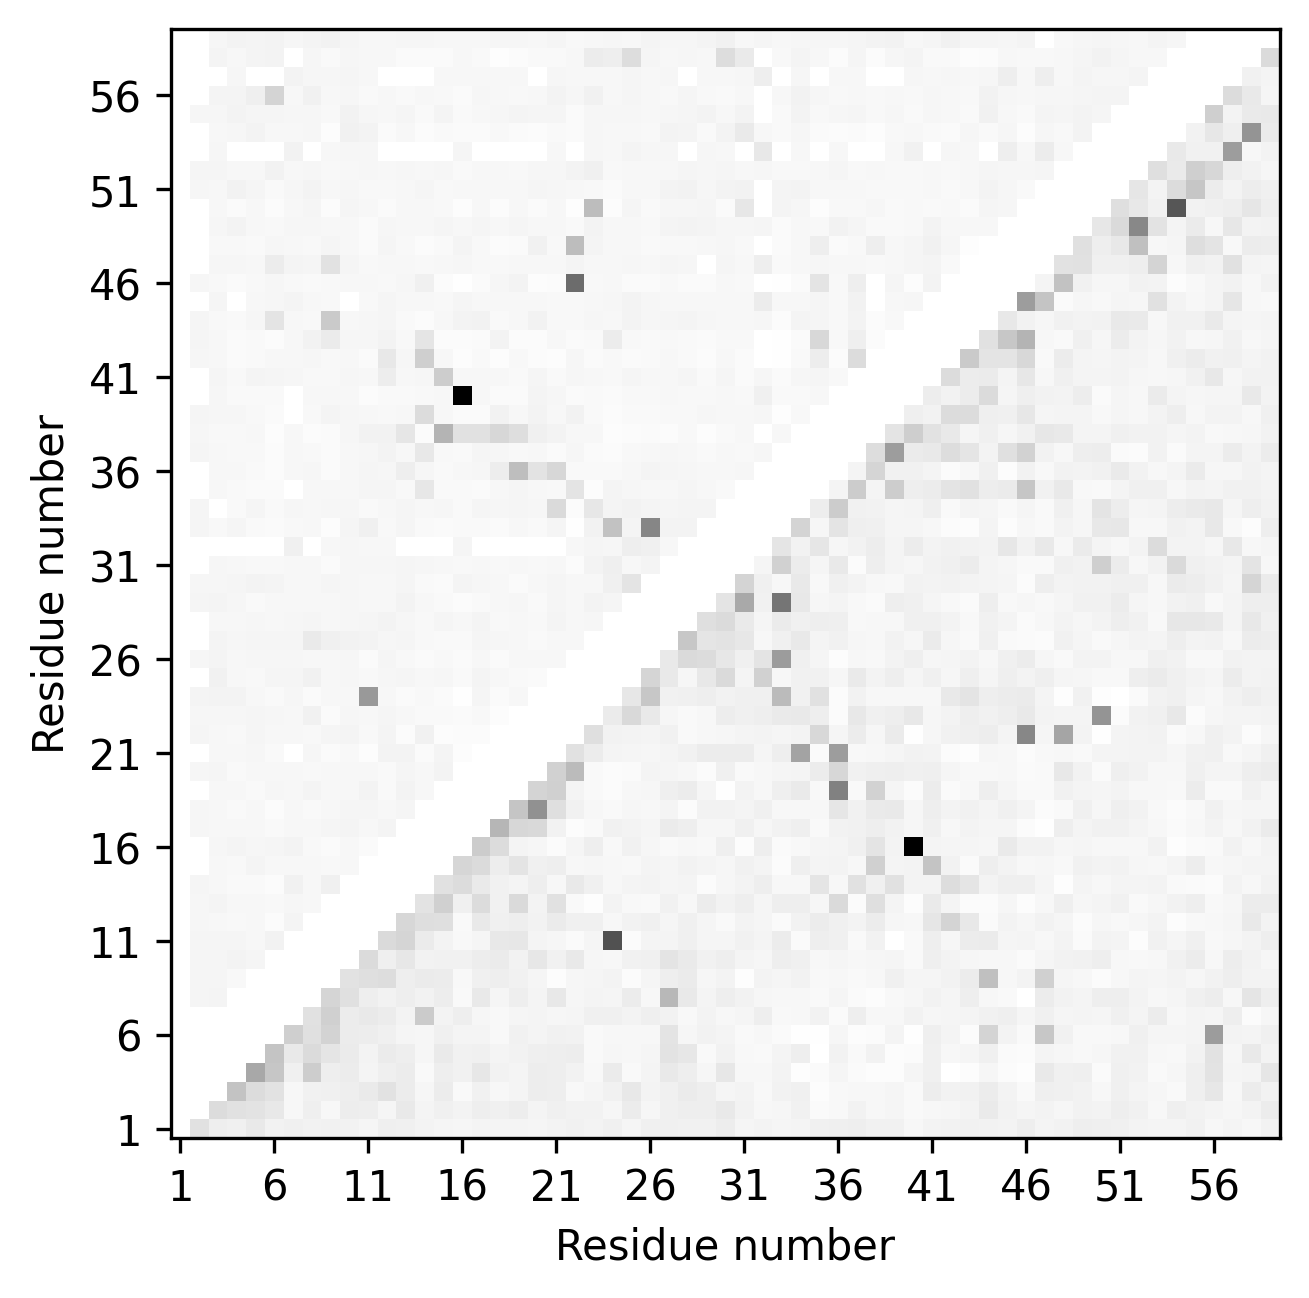
$> conkit-plot cmat toxd/toxd.fasta fasta toxd/toxd.mat ccmpred
The call above uses the contact prediction file toxd.mat file, which is in ccmpred format, and plots the following 2D contact map matrix stored in the file toxd/toxd.png
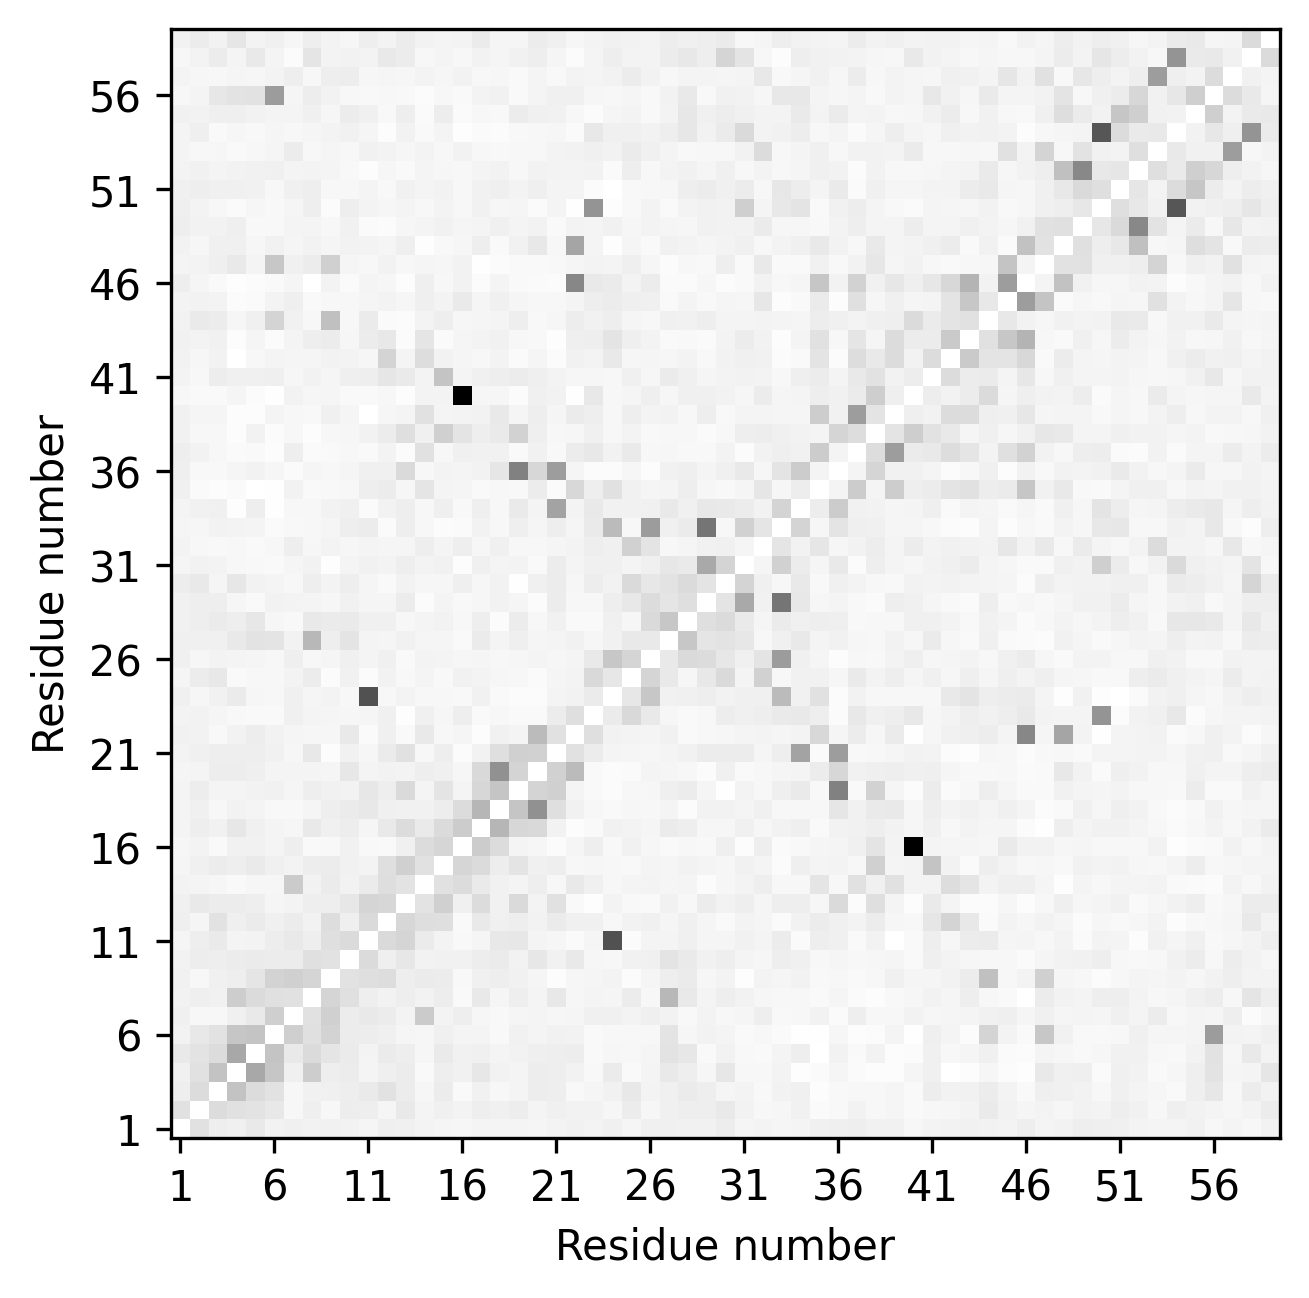
You could also add a second contact prediction file to the call to compare two maps against each other.
$> conkit-plot cmat -e toxd/toxd.psicov -ef psicov toxd/toxd.fasta fasta toxd/toxd.mat ccmpred
The call above produces a contact map plot looking like this. The gray points are the reference contacts, and matched and mismatched contacts are shown in color. The top triangle is the second contact map from file toxd/toxd.psicov whereas the bottom one is from toxd/toxd.mat.