"""
Contact Map Precision Evaluation
================================
This script contains a simple example of how you can evaluate
the precision scores of your contact map using ConKit
"""
import conkit.io
import conkit.plot
# Define the input variables
sequence_file = "toxd/toxd.fasta"
sequence_format = "fasta"
contact_file = "toxd/toxd.mat"
contact_format = "ccmpred"
# Create ConKit hierarchies
# Note, we only need the first Sequence/ContactMap
# from each file
seq = conkit.io.read(sequence_file, sequence_format).top
conpred = conkit.io.read(contact_file, contact_format).top
# Assign the sequence register to your contact prediction
conpred.sequence = seq
conpred.set_sequence_register()
# We need to tidy our contact prediction before plotting
conpred.remove_neighbors(inplace=True)
conpred.sort('raw_score', reverse=True, inplace=True)
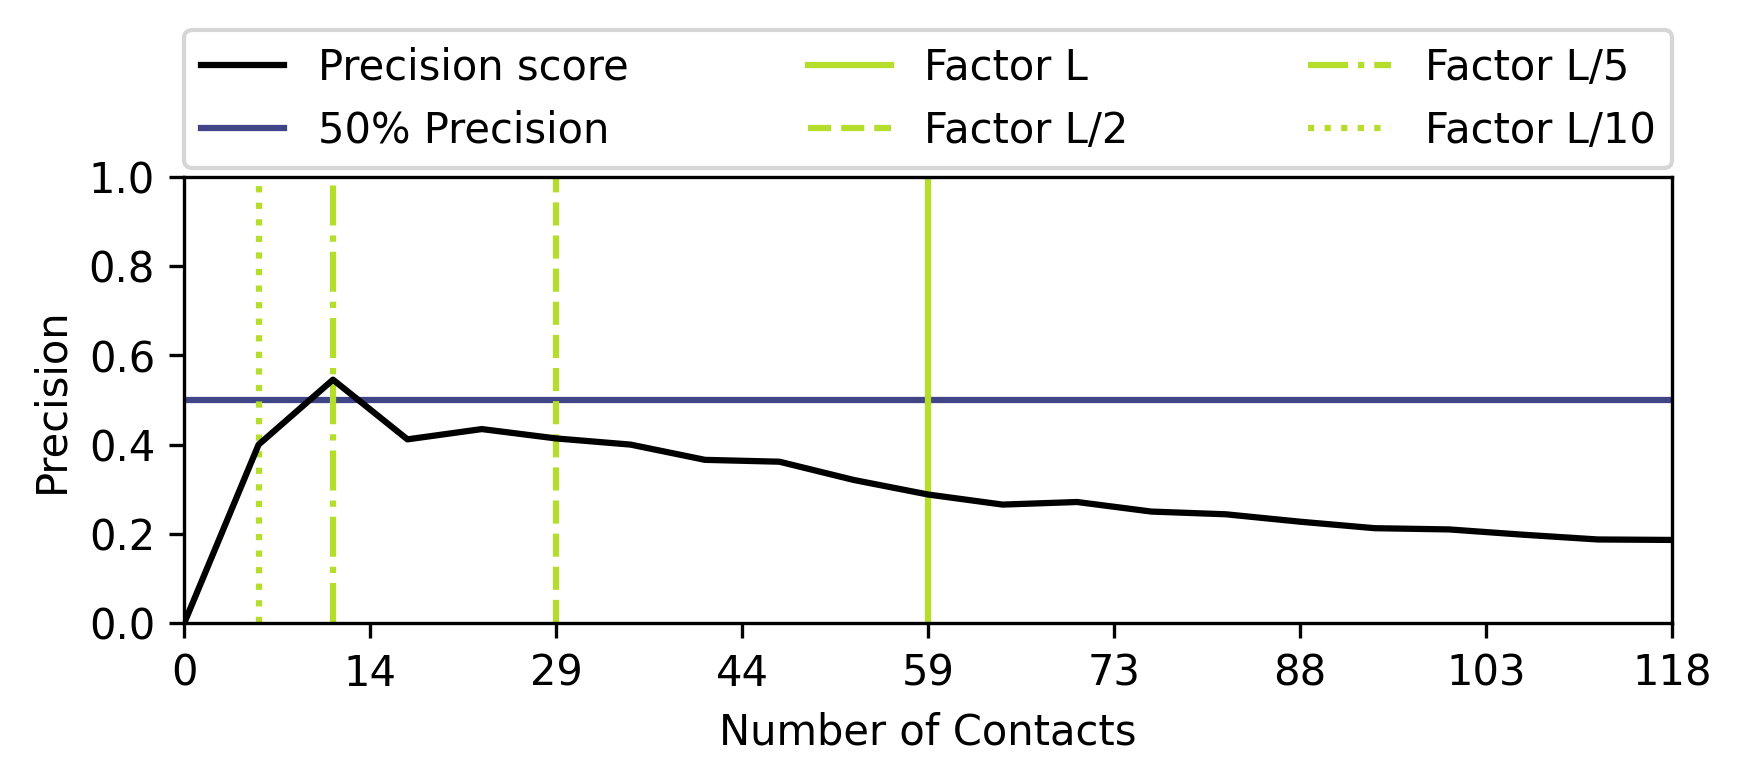
# ====================================================
# The code above is identical to the previous example
# Now we need to compare it to our reference structure
pdb_file = "toxd/toxd.pdb"
pdb = conkit.io.read(pdb_file, "pdb").top
# The two keywords do the following:
# - remove_unmatched : remove contacts absent from the pdb_file
# - renumber : match the numbering to the pdb_file
map_matched = map.match(pdb, remove_unmatched=True, renumber=True)
# Then we can plot the evaluation plot
fig = conkit.plot.PrecisionEvaluationFigure(map_matched, cutoff_step=0.1, min_cutoff=0.0, max_cutoff=2.0, legend=True)
fig.savefig("toxd/cdens.png")