"""
Simple distogram plotting
=============================
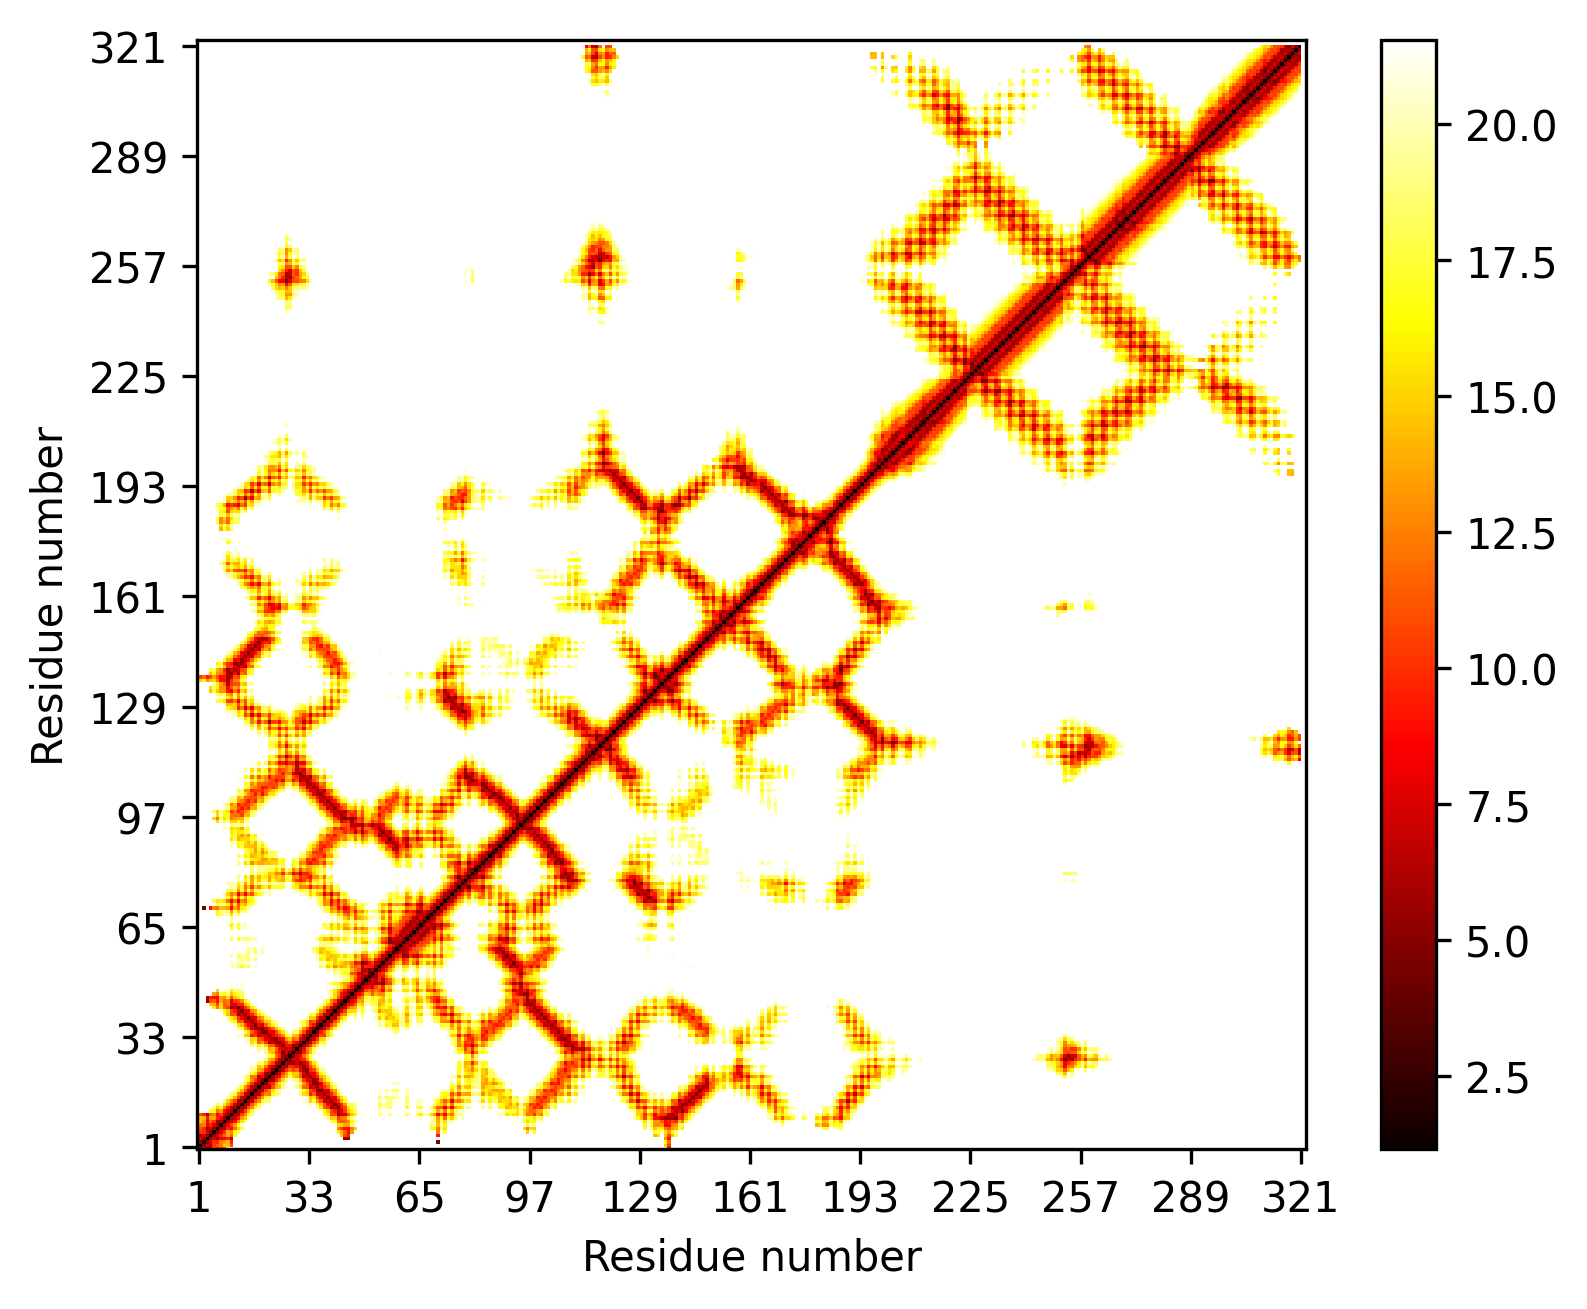
This script contains a simple example of how you can plot
distograms using ConKit
"""
import conkit.io
import conkit.plot
# Define the input variables
sequence_file = "7l6q/7l6q.fasta"
sequence_format = "fasta"
distance_file = "7l6q/7l6q.af2"
distance_format = "alphafold2"
# Create ConKit hierarchies
# Note, we only need the first Sequence/Distogram
# from each file
seq = conkit.io.read(sequence_file, sequence_format).top
distpred = conkit.io.read(distance_file, distance_format).top
# Assign the sequence register to your contact prediction
distpred.sequence = seq
distpred.set_sequence_register()
# Then we can plot the distogram predicted with AlphaFold 2
fig = conkit.plot.DistogramHeatmapFigure(distpred)
fig.savefig("7l6q/7l6q.png")